
A. Visualization
Visual. Source : ppmworks
Visualization is the process of presenting data in visual form. The processed data will be presented in the form of reports or data visualizations. Good visualization is necessary so that our data can be understood and analyzed easily.
We can visualize data in many different ways, according to our needs. Here are some ways we can use:
B. Dataset
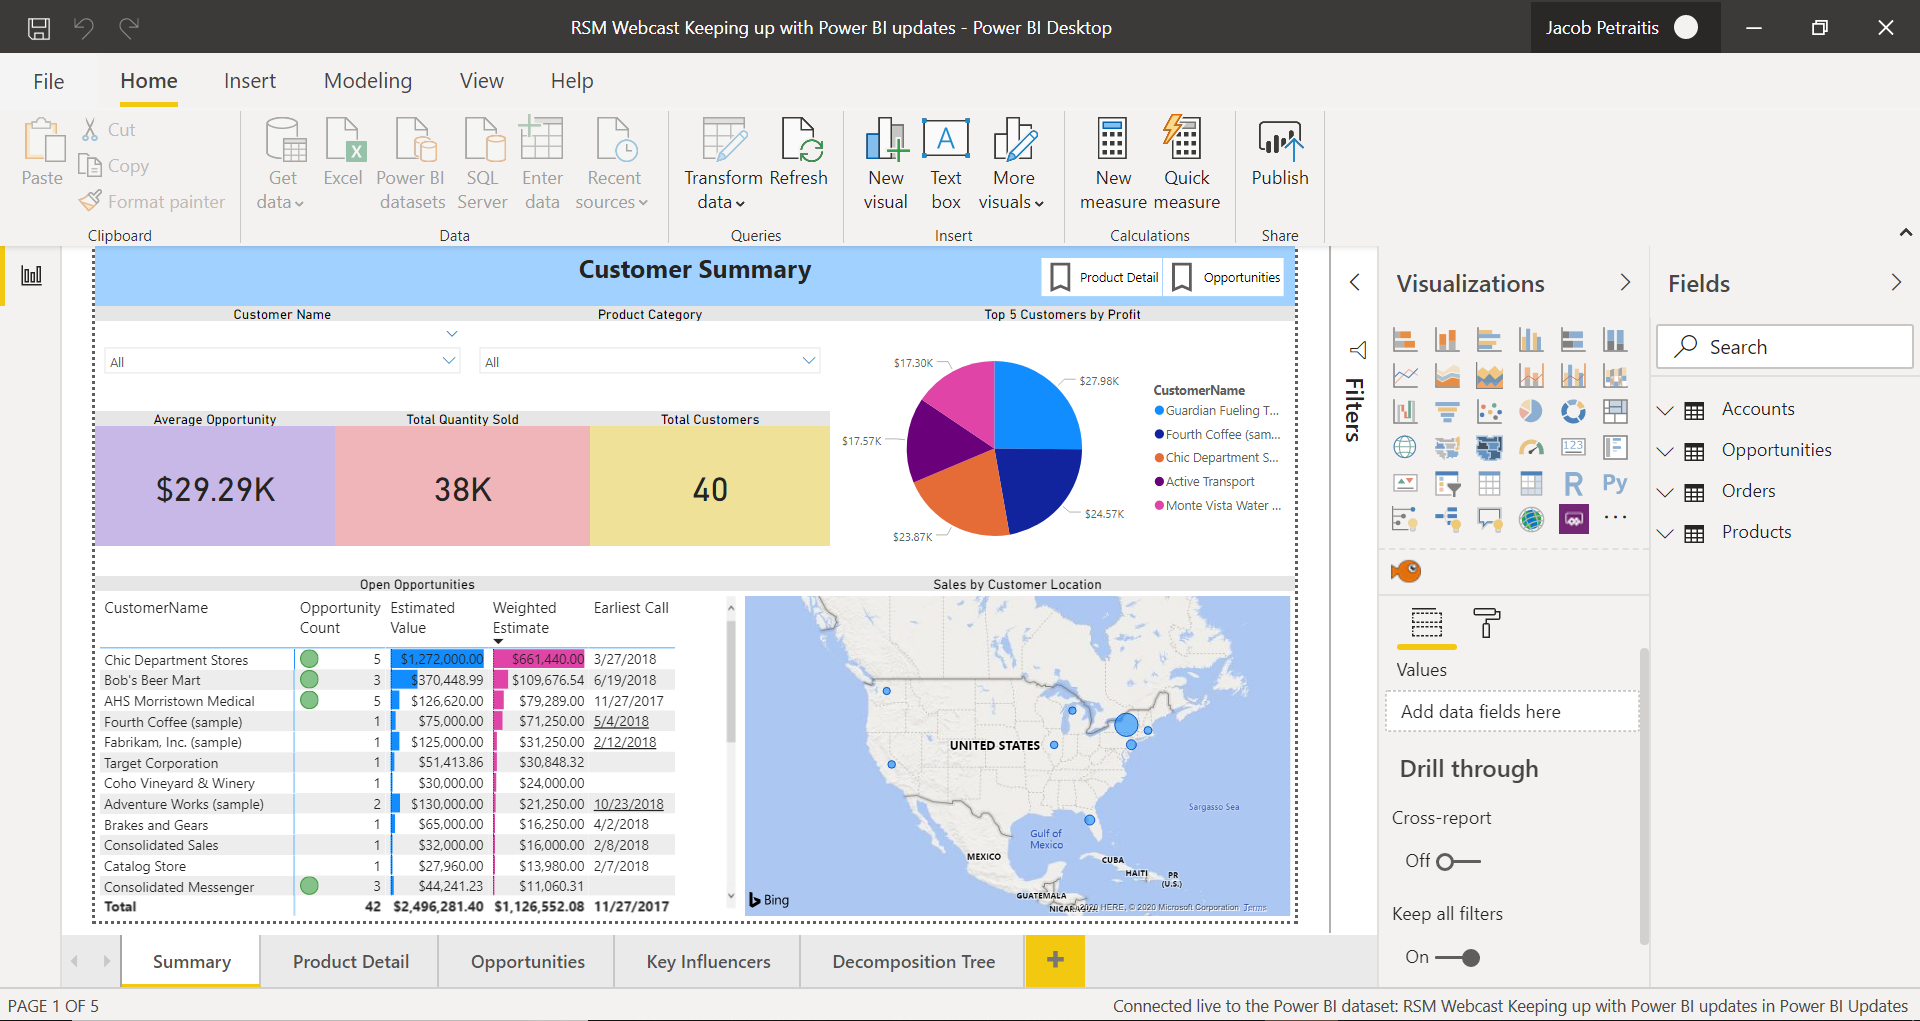
Dataset Source: RSM Technology Blog
A dataset is a collection of data that is ready to be used to create visualizations and reports. Before visualizing we need datasets as material that we will visualize. A dataset hosted by Power BI Service or Analysis Services is a dataset that represents a model.
The dataset model has the ability to store imported data or submit query requests directly to the underlying data source. In addition, this model can even combine the two.